PORT
FOLIO

Winston Green | Product & AI Builder

Scroll
Winston Green Headshot

Bio

I'm a product leader who likes messy problems with real constraints: revenue, operational load, data quality, and the uncomfortable truth that most "strategies" die in implementation.

Lately, I’ve been building hands-on with AI-assisted development and modern tools to turn product ideas into real experiences, moving faster from concept to shipped product.

At Spoonity, I helped evolve the platform from loyalty-first into an AI-native engagement suite—spanning Apex (automation), Tomas (agentic layer), and Spoonity Intelligence (analytics merchants can actually use). Along the way, I led a 5-week pricing & packaging redesign to make value legible, reduce exceptions, and support a move upmarket.

Before that, I owned Odeko's delivery management and routing platform—turning routing from a fragile constraint puzzle into a scalable system that supported expansion, reliability, and cost control.

Most importantly, I'm a former varsity football athlete turned girl-dad who loves story-time and bike rides.

Resume

<WinstonGreen type="Builder" />

resume.tsx
winstons_world.asm NEW

Spoonity

Director of Product & Principal Product Manager

Built Apex + Tomas (multi-agent "Autonomous CMO") and led pricing redesign → 2.5–4× pipeline ACV.

Jul 2023 — Oct 2025

Odeko

Product Manager

Owned delivery platform + ML routing; scaled multi-market reliability + cost.

Aug 2021 — Jan 2023

Bell

Product Manager

Shipped Android TV relaunch + Prime Video/Hayu integrations for 1.4M+ users.

Jun 2019 — Aug 2021

Bell

Strategy Ops Manager

Ran $11M ops portfolio; prioritized CX + AI/ML initiatives to ROI targets.

Mar 2018 — Jun 2019

Stembis

Co-Founder

Built an Etsy style marketplace from 0 to 1, securing 15+ vendor partnerships and driving initial traction.

Mar 2018 — Jan 2019

Ideal Protein

Business Intelligence Lead

Built Tableau/self-serve BI for 3,000+ clinic partners, enabling real-time analytics.

Aug 2015 — Sep 2016

Target Canada

Senior Financial Analyst & other roles

Owned $55M P&L; drove $15M margin improvements through vendor negotiations.

Aug 2012 — May 2015

// Education

EDHEC

MBA — Strategy & Entrepreneurship

2017
MIT xPRO

Certificate — Data Science

2017
University of Guelph

BCom — Finance & Economics

2012
Winston's World — 16-bit Career Map
6502 RENDERED
Ready
UTF-8

How I Build

I use agentic workflows across the full product cycle — from discovery and research to specs, design, build, and launch.

Problem Framing

Problem Framing

Clarify the product question, pressure-test assumptions, and shape the opportunity.

Tools
Custom GPTs

Research & Discovery

Research & Discovery

Synthesize context, competitor material, and real community pain points to ground ideas in actual demand.

Tools
NotebookLM
Custom GPTs
Gumloop
Reddit

Spec Writing

Spec Writing

Draft PRDs and structure edge cases faster without losing product intent.

Tools
Custom GPTs

Concept Design

Concept Design

Explore layouts and interaction patterns quickly to compare directions.

Tools
Stitch
Veo 3
Figma
Midjourney

Prototyping & Build

Prototyping & Build

Turn concepts into testable artifacts and use AI-assisted coding to implement the product end-to-end.

Tools
Antigravity
Replit
MCP Servers
Agent Skills
Opus
Codex

Deployment

Deployment

Ship quickly through modern deployment workflows for fast iteration.

Tools
GitHub
Vercel

Selected Work

#Product_Strategy  •  #AI_Experiences  •  #Shipped_Artifacts

case study — 01

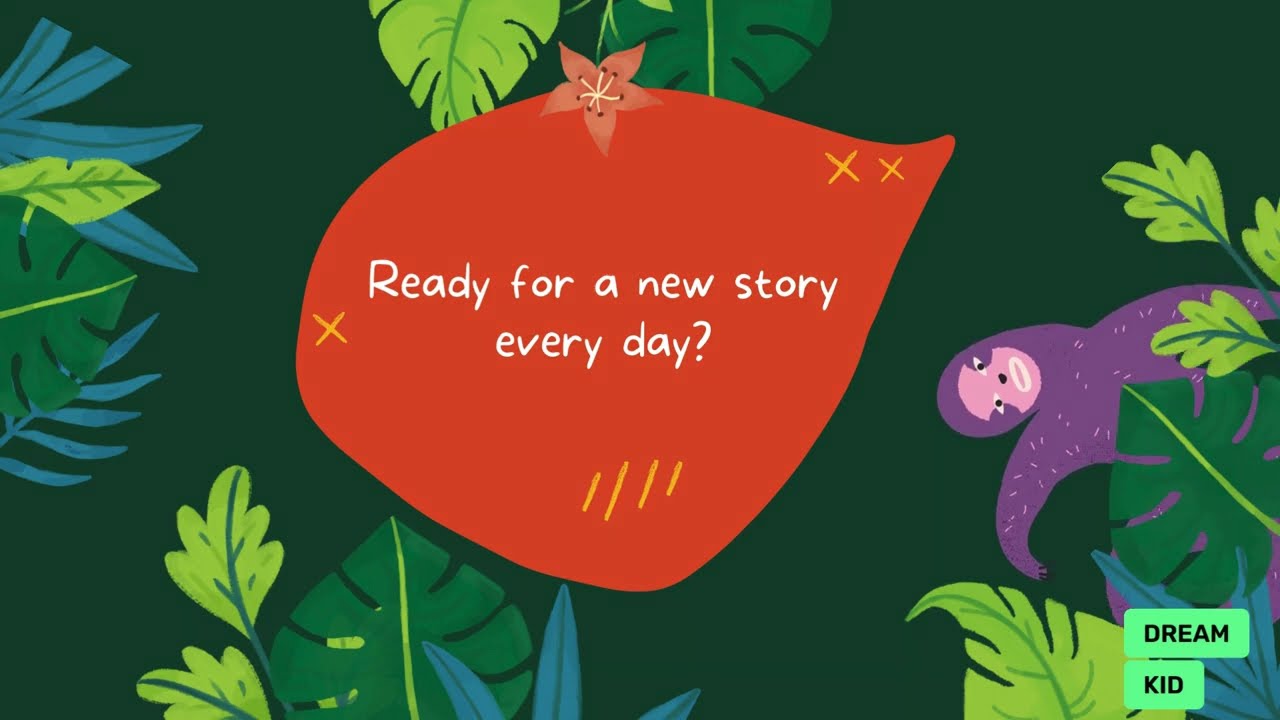
Dream Kid — Generative AI storytelling for hospitalized children

A.Team GenAI Hackathon Product Lead · AI Product Design June 2023
Generative AI Multi-modal AI Healthcare Human-centered AI

Dream Kid is a generative AI storytelling prototype designed to help hospitalized children cope with fear and uncertainty. The system generates personalized storybooks where the child becomes the hero of their own recovery journey. By translating medical procedures into story-driven metaphors, we turned a frightening environment into a space for adventure and emotional process.


🥇 Winner
A.Team GenAI Hackathon
Tech Week
Presented at Chicago Tech Week
Multi-modal
Narrative, Visuals, and Voice
Dream Kid Demo Video
play_arrow
Dream Kid IPad Interface
Dream Kid Story Example

Context

What if a child’s hospital stay could be reframed as an adventure story where they are the hero?

Each year, roughly two million children are admitted to hospitals in the US, most admissions being unplanned. For young patients, this removal from routines and confrontation with unfamiliar terminology can be deeply frightening. While clinical care is exceptional, tools for emotional processing are rarely designed for young audiences.

The Problem

Hospitalized children often struggle to understand complex medical explanations, leading to anxiety and a loss of control.

Core Issues

  • warning
    Anxiety & Confusion Complex medical terminology and unfamiliar environments cause emotional distress.
  • warning
    Loss of Control Sudden removal from familiar routines and autonomy during treatment.
  • warning
    Clinical vs Emotional Healthcare systems over-index on clinical care while under-serving emotional wellness.

The Goal

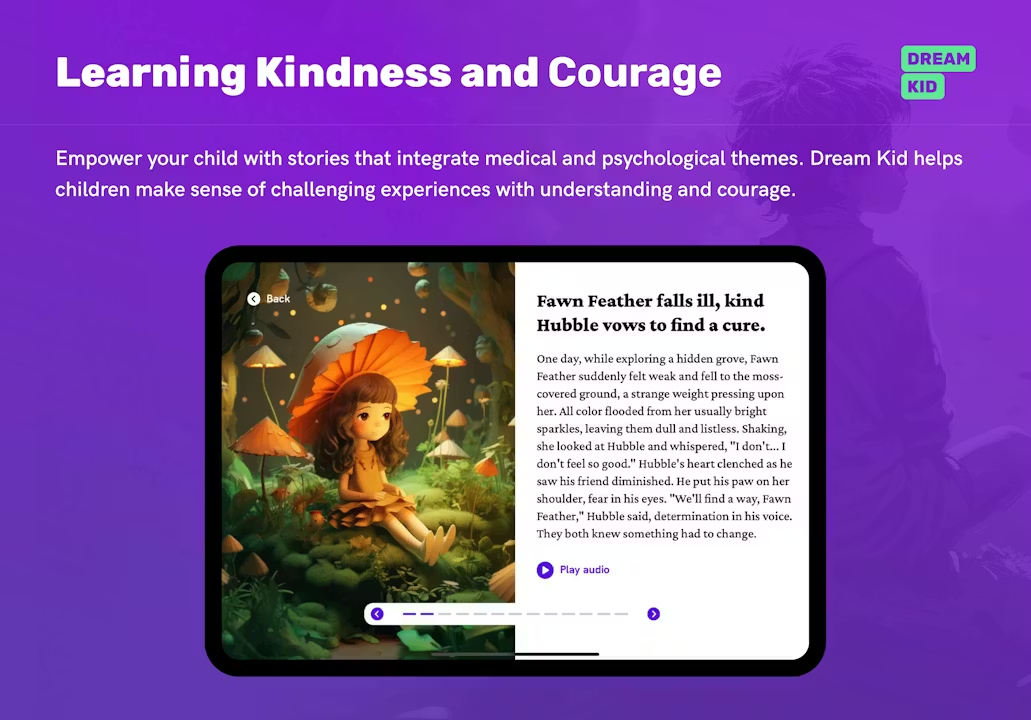
"Success meant creating a scalable tool that translates medical journeys into story-driven metaphors, helping children emotionally process their experience while feeling empowered."

Approach

Dream Kid orchestrates multiple generative AI systems to turn raw medical context and child interests into a fully immersive, multi-modal storybook.

System 01

Narrative (LLMs)

OpenAI models generated personalized stories that balanced entertainment with educational clarity and emotional support.
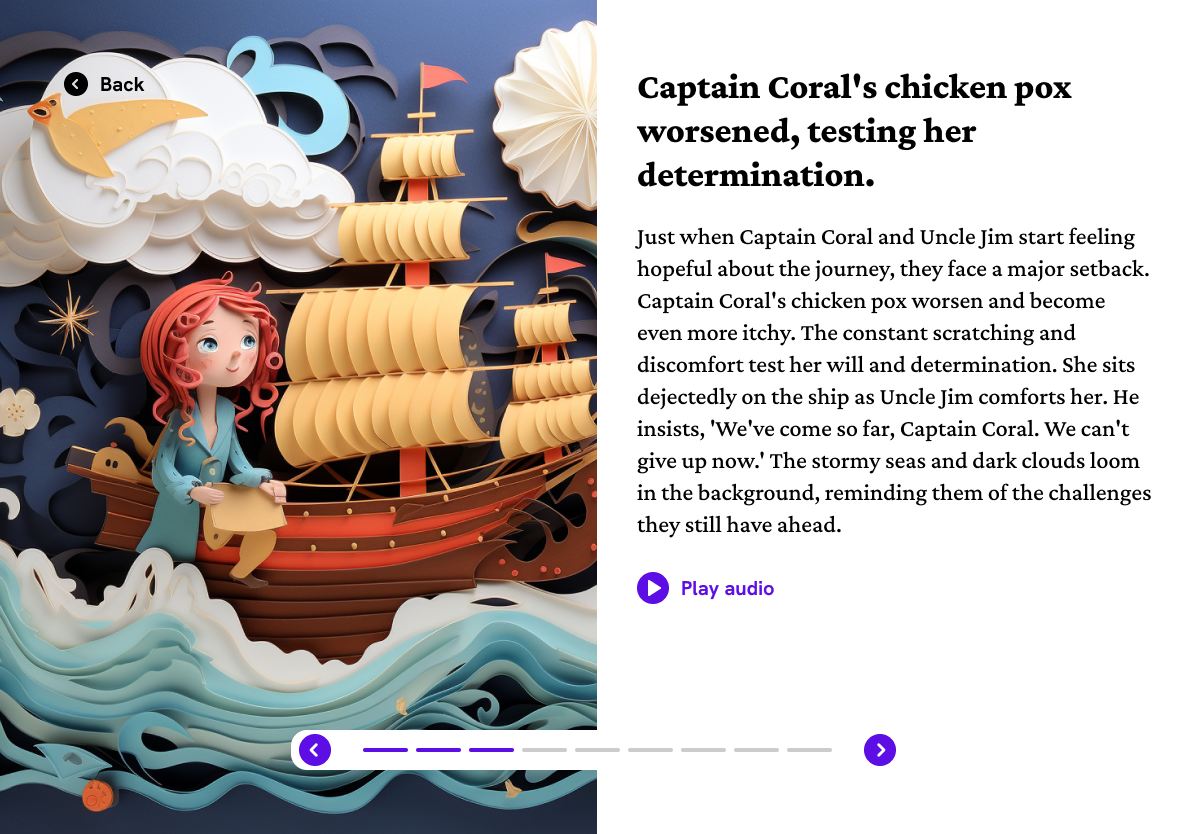
System 02

Illustrations

Midjourney produced custom visual scenes aligned with the story structure, creating a visually rich world for the child.

System 03

Voice (Narration)

ElevenLabs created expressive narration, allowing the stories to be experienced as immersive audiobooks.

System 04

Orchestration

Complex prompt engineering guided the story to translate medical treatments into empowering metaphors.

Impact

COMMERCIAL OUTCOMES

  • emoji_events
    🥇 1st Place Winner — A.Team GenAI Hackathon (June 2023).
  • campaign
    Featured platform presentation at Chicago Tech Week.

STRATEGIC OUTCOMES

  • check_circle_outline
    Explored human-centered AI applications beyond productivity.
  • check_circle_outline
    Established a multi-modal GenAI workflow for specialized content.

What I'd do differently

  • Deep EHR Integration

    Integration with Electronic Health Records (EHR) would allow the story context to be pulled automatically, reducing manual burden on hospital staff while ensuring clinical accuracy in metaphors.

  • Narrative Continuity

    Develop a "persistent hero" system where a child's story evolves across multiple visits, ensuring a sense of ongoing progress and mastery over their healthcare journey.

Artifacts

case study — 02

Tomas — Human touch, machine muscle

Spoonity Director of Product Concept → Beta (Sept 2025)
AI Products Agents CDP Platform Strategy

Tomas is Spoonity's "Autonomous CMO"—an agentic layer that turns merchant data and market signals into briefings, recommendations, and draft execution. We shipped a September beta across Brandkit, Social Listening, Competitor Analysis, Campaigns, Journeys, and Intelligence. Then proved value through a repeatable loop: Tomas-branded analytics email briefings pulled merchants back into dashboards and drove action.


+200%
Weekly active users
3x
Close rate on package upgrades
+25%
Growth in campaign launches
Tomas AI Agent Interface — Your Autonomous CMO Landing Page
Tomas Product Overview — Human touch, machine muscle
Tomas Intelligence Dashboard — Social Listening and Review Analysis
+1 more

Context

Merchants don't need more tools. They need momentum.

Most operators don't have a dedicated analyst, strategist, or agency on call. So even when the data is there, the workflow breaks at the moment that matters: "What does this mean?" "What should I do next?" "Can I ship something that doesn't look amateur?"

Tomas was the bet that the product could act like a teammate—brief you, point to the lever, draft the work, and make execution feel obvious.

The Problem

The analytics stack was rich with data, but merchants still struggled to turn insight into action.

Core Issues

  • warning
    Analytics Under-ConsumedDashboards are valuable once you know what you’re looking for. Most operators did not have the time or context to explore them.
  • warning
    Insights Without ActionReports surfaced patterns and anomalies, but translating those insights into campaigns still required manual work.
  • warning
    Signal OverloadReviews, competitor activity, menu changes, and local market signals created a constant stream of information with no way to synthesize it.
  • warning
    Execution FrictionEven when the next step was obvious, building the segment, campaign, and creative still required time most merchants did not have.

The goal

"Success meant closing the loop between insight and execution. Signals should automatically produce recommendations, draft actions, and measurable outcomes."

What We Shipped

(Beta — Sept 2025)

Beta launch: We introduced Tomas through a lightweight landing experience and early-access intake flow that captured merchant context and seeded the system for personalized insights.

Product pillars

Pillar 01

Brandkit

Brand POV, ideal customer, tone-of-voice, author persona

Pillar 02

Social Listening

Google Reviews summary + themes + examples

Pillar 03

Competitor Analysis

Local competitor synthesis + positioning + hooks

Pillar 04

Campaigns

Tomas-guided creation (strategy + draft content)

Pillar 05

Journeys

Visual automation builder for segmented, personalized flows

Pillar 06

Intelligence

Briefing layer that summarizes performance and points to next steps

mark_email_read

The Credibility Lever

The fastest way to make Tomas real wasn't a demo screen—it was showing up where merchants already operate.

We rolled out Tomas powered analytics summary emails (built on top of Spoonity Intelligence) that translate performance into plain-language takeaways, highlight patterns worth noticing, and propose next actions that can be turned into campaigns and journeys.

This moved Intelligence from "nice dashboards" to "a system that nudges action."

Technical Approach

Agent loop (human-in-the-loop by design) Tomas collects context → pulls grounded facts → synthesizes patterns → recommends actions → drafts execution → merchant approves (or dismisses) and Tomas learns what "useful" means.
Grounding + tool use Grounded SQL extractions for business metrics, web scraping for competitor signals, and review ingestion for sentiment + theme detection. Models orchestrate queries + retrieval + transforms, not just free-write.
Evaluation framework We used DeepEval (open source) to operationalize quality — measuring answer relevancy, faithfulness, contextual relevancy/recall/precision, task completion, and tool correctness. If Tomas is going to advise operators, it has to be reliably grounded, not "confidently creative."

Impact

Commercial outcomes

  • trending_up
    3x close rate on package upgrades (marketing → executive analytics).
  • trending_up
    Improved deal urgency and value story for high-level analytics.

Operational outcomes

  • check_circle_outline
    +200% weekly active users on Spoonity Intelligence (active dashboard engagement).
  • check_circle_outline
    +25% growth in campaign launches via signal-based recommendations.

What I'd do differently

  • Design onboarding around one clear win

    Focus the initial experience on a single activation path: generate a brief, select a recommendation, and launch the first campaign.

  • Operationalize evaluation early

    Pair automated LLM evaluations with periodic human review to create a durable scorecard for recommendation quality and agent behavior.

Artifacts

case study — 03

Pricing & Packaging Redesign

Spoonity Director of Product Core platform monetization 5 week sprint (2024)
Monetization Strategy → Execution GTM Enablement

We reset Spoonity’s pricing from a module-style menu into fewer, outcome-led packages with public-ready fences, a hybrid base + metric model, and productized onboarding/offboarding. I ran a structured 0→7 pricing sprint and owned the package design, fence logic, model mechanics, governance, and enablement.


2.5–4x
Increase in weighted new-pipeline ACV
~50%
Lift in package attach-rate
downloadingExc.
Fewer exceptions and discounting
Pricing Redesign — Customer Sophistication Matrix
Pricing Deal Desk Workstream

Context

North star: frictionless purchasing.

Spoonity’s pricing model was built for an earlier stage of the company. A simple per-location fee worked when most customers were small merchants and the product surface area was narrow. As the platform expanded and the business moved upmarket, the model struggled to keep pace with the value delivered and the operational complexity required to support it.

The Problem

The pricing model created several structural issues that became harder to ignore as the business scaled.

Core Issues

  • warning
    Pricing did not scale with customer valueStatic per-location pricing meant enterprise merchants processing millions paid similarly to mid-market customers.
  • warning
    Packaging did not map to buyer demandBuyers struggled to understand how packages translated into outcomes, which pushed Sales toward custom bundles.
  • warning
    Pricing governance was weakFrequent exceptions and discounting made forecasting and pricing discipline difficult to maintain.
  • warning
    Implementation economics were misalignedOnboarding lacked structure and expanded customer asks increased delivery effort without consistent funding.

The goal

"Success meant building a pricing system that scaled with customer value, created a clearer buying motion, and aligned revenue with the real cost of delivery."

What we tried before

We had evolved pricing deal-by-deal (new modules, new exceptions, discounts to close). It solved local problems but compounded global complexity. This sprint was a deliberate system reset.

Approach

Principle 01

Unitary Purpose

Every package has one job and its own source of demand.

Principle 02

Strategic Fencing

Fences must be Discreet · Stable · Fair · Obvious · Valuable.

Principle 03

Economic Contrast

“Valuable” means fences create meaningful economic separation (e.g., ≥30% CLTV/CAC contrast).

Principle 04

Budget Alignment

Price every budget—map metrics to the stakeholder who can defend the spend.

Success criteria

  • check Reduce time-to-quote by 50%
  • check Increase average ACV on new deals
  • check Eliminate unapproved discounting
  • check Clear upsell paths for all segments
Option Pros Cons Decision
Keep current modules Lowest friction change. Maintains confusion; doesn't solve value gap. Rejected
Single bundle Radically simple. Forces small customers to overpay or churn. Rejected
Pure usage Perfect theoretical alignment. Unpredictable revenue; hard for buyers to budget. Rejected
Tiered packages Predictable base + upside; familiar model. Requires strict fencing definitions. Selected

Chosen Design

Packaging

We structured our offering around the primary sources of demand. Instead of a laundry list of features, we grouped capabilities into three buckets:

  • Defaults: Core features included in every tier (e.g., Menu Management).
  • Add-ons: Specialized modules for specific verticals (e.g., Loyalty, Kiosks).
  • Services: Implementation and success packages sold separately.

Fences

Billing Complexity
  • Standard invoicing
  • Consolidated billing
Integration State
  • Out-of-box plugins
  • API Access
Org Model
  • Single location
  • Franchisor vs Franchisee

Pricing model mechanics

Flat Platform Fee + Metric-based Fees (Orders)

The platform fee covers infrastructure and support, while the per-order fee scales directly with the customer's success and usage volume.

Onboarding & offboarding policies

  • Fees tied to MRR

    Onboarding fees are now calculated as a percentage of Monthly Recurring Revenue (“MRR”), ensuring high-touch implementation is funded by the deal value.

  • Productized Offboarding

    We defined clear "end of life" policies for churned customers to reduce data-holding costs and legal exposure.

Execution

FORUM

Weekly Exec Sync

Regular alignment with leadership to clear blockers.

LOOP

Tight GTM Feedback

Continuous feedback from sales and success teams.

ARTIFACTS

Output-driven

Focus on tangible artifacts over theoretical decks.

0 → 7 Workstreams

Step 01
Baseline

Captured where pricing broke today: analyzed discount variance & margin compression.

Step 02
Capabilities

Audited every feature to map "willingness to pay" vs "cost to serve".

Step 03
Fences

Defined the hard lines between segments: volume limits, API access, & SLAs.

Step 04
Packaging

Bundled features into narratives (Growth, Scale, Enterprise) not lists.

Step 05
Model + wallets

Built Excel models to simulate revenue impact & stress-tested deals.

Step 06
Price points

Calibrated base fees and metric rates to ensure upside without shock.

Step 07
Validation

Ran "shadow pricing" on incoming deals to test sales confidence.

Impact

Commercial outcomes

  • trending_up
    2.5–4× increase in ACV for new pipeline deals.
  • trending_up
    ~50% increase in attach rates for premium modules.
  • trending_up
    Increased cash collection due to onboarding mechanics.

Operational outcomes

  • check_circle_outline
    Reduced sales negotiation time by providing clear guardrails.
  • check_circle_outline
    Simplified billing operations by reducing SKU count by 80%.
  • check_circle_outline
    Better forecasting accuracy for finance teams.

What I'd do differently

  • Stronger migration playbook

    Build better guardrails for the shift from per-location to value-based billing to reduce Sales friction.

  • Document edge case economics

    Quantify individual customer delivery effort more strictly to prevent implementation margin erosion.

  • Medium-to-long-term touchpoints

    Establish structured quarterly reviews to ensure ongoing pricing discipline as customer accounts evolve.

Artifacts

case study — 04

Apex — Platform Architecture Rebuild

Spoonity Director of Product Year 1
Platform Data/AI Architecture Strategy → Roadmap

Apex started as a marketing automation wedge to unlock faster time-to-value and a product-led motion, quickly proving traction while shipping a real automation surface (journey builder, triggers, and analytics). In the process, the real constraint surfaced: it wasn’t “more journeys,” it was fragmented customer data and inconsistent platform primitives. That drove a bigger pivot from loyalty-first to customer/data-first, where I defined the Year-1 foundation (CDP core, pipelines, APIs) needed to scale omnichannel automation and later support Tomas as the AI action layer.


~$150K ARR
Generated in Year 1
Loyalty → Data
Strategic Platform Pivot
4 → 1
Customer data sources unified
Apex — CDP Concept Design
Apex — Date Trigger Property
Apex — Visual Journey Builder

Context

Merchants don't need more tools. They need momentum.

Spoonity was historically sales-led, with heavy onboarding and bespoke delivery. Apex started as a deliberate bet: ship a merchant-facing automation product that could create faster time-to-value and a product-led acquisition motion.

As we built and sold automation, a deeper insight surfaced: loyalty and marketing were acting like separate tools because customer data wasn’t unified. Without shared primitives (identity, events, segmentation), every new “feature” became a bespoke project.

The Problem

Merchants wanted to understand and influence customer behavior, but the legacy monolith was crumbling under its own weight. The platform reality created four constraints:

Core Issues

  • warning
    Fragmented DataCustomer profiles were splintered across 4 different silos with no unified identifier.
  • warning
    Tool Sprawl We were maintaining a dozen different internal dashboards to answer basic commercial questions.
  • warning
    Operational Burden Every release required hours of downtime and patchwork manual QA.
  • warning
    Change was expensive The cost of shipping kept rising, so new capabilities took longer to deliver and were harder to maintain once launched.

Business Risk

"If we don’t fix the foundation, we can’t scale the product. The risk isn’t missing features—it’s losing trust as reliability and onboarding costs compound."

Approach

We faced a critical strategic divergence. Do we patch the ship while sailing, or build a new vessel alongside it? We chose B because it reduced the marginal cost of every future capability (automation, omnichannel, AI) and made outcomes defensible at scale.

Option A

Refactor in Place

Continue servicing the monolith, extracting microservices piece-by-piece over 3 years.

  • Lower immediate risk
  • Slowest time-to-value
  • Retains legacy data schemas
Chosen Path
Option B

Customer Data Platform

Greenfield build of a new data core ("Apex") centered on event streaming, migrating tenants gradually.

  • High initial engineering cost
  • Enables AI & Real-time use cases
  • Clean break from technical debt

The 5 Primitives

Apex was designed around five immutable primitives that defined the new system architecture.

Primitive 01

Identity

A unified, deduplicated customer record that serves as the canonical foundation for personalization, suppression, segmentation, and reporting.

Primitive 02

Event Stream

Structured, reliable event flows that power triggers, attribution, analytics, and AI-ready retrieval across the platform.

Primitive 03

Segmentation

Durable audience objects defined once and activated everywhere to eliminate one-off targeting logic.

Primitive 04

Activation

A visual journey builder with triggers and analytics that turns intent into execution within a single system.

Primitive 05

AI Hooks

Clean data primitives and retrieval paths that allow AI to operate on grounded, contextual data instead of guesswork.

Impact

COMMERCIAL OUTCOMES

  • trending_up
    Successfully launched first 5 enterprise customers on Apex.
  • trending_up
    Unlocked "Marketing Automation" product line ($150k ARR).

OPERATIONAL OUTCOMES

  • check_circle_outline
    Deployment frequency increased 10x (Daily vs Monthly).
  • check_circle_outline
    Unified fragmented customer data into a single profile layer.

What I'd do differently

  • Pull CDP primitives earlier

    Pull CDP primitives (identity + events + segmentation) earlier so every product surface compounds value instead of rebuilding foundations.

  • Invest earlier in the loyalty-installed base

    Invest earlier in the loyalty-installed base instead of over-indexing on a net-new PLG interface, aligning the roadmap with where adoption compounds fastest.

Artifacts

case study — 05

Scaling the Last Mile

Odeko Product Lead Q1–Q4 2022
Operations Web & Mobile App Delivery Platform Machine Learning

In 2022, Odeko's delivery operations were hitting a ceiling—routing was a fragile “black box” that struggled to keep pace with rapid expansion. We transformed it into a scalable delivery platform by pairing a Delivery Management command center with a configurable routing constraint system, making real-world constraints first-class and turning reactive firefighting into a repeatable system that could scale across markets without bespoke logic.


+7%
Delivery Success Rate
~$170k
Fleet Maintenance Savings
~$13k
Monthly Cross-dock savings
Delivery System — Driver Navigation
Delivery System — Automated Routing
Delivery System — Capacity Management

Context

Odeko's value proposition hinges on reliable, next-day delivery to coffee shops and cafes. As we scaled, the manual overhead of managing thousands of stops across diverse urban markets became the primary bottleneck for growth. Routing wasn't just a utility; it was the mission-critical core of our unit economics.

The Problem

The legacy routing tool was a "black box" that would often crash or produce nonsensical routes when faced with new market variables, requiring constant developer intervention.

Core Issues

  • warning
    Manual Market LogicEach new city required custom routing and driver payout logic, making expansion slow and fragile.
  • warning
    Routing Was a Black BoxWhen routes failed or produced bad outputs, dispatchers had no visibility into why or how to correct them.
  • warning
    Capacity BlindnessDispatchers lacked reliable visibility into driver availability, vehicle constraints, and delivery windows.
  • warning
    Tribal KnowledgeCritical delivery constraints lived in dispatchers' heads instead of the system.

The goal

"Success meant making routing and delivery operations repeatable, explainable, and configurable—without custom code per market."

Approach

Rather than patch the routing engine, we rebuilt the delivery platform so routing logic, operational constraints, and market configuration could scale together.

Layer A

Management Platform

Operations control layer that provides dispatch visibility, delivery monitoring, and automated customer notifications while allowing teams to manage delivery workflows in real time.

Layer B

Constraint System

Routing constraint engine that encodes delivery rules such as SLA windows, vehicle limits, building access requirements, and density optimization.

Routing Engine

Strategy 01

Clustering

Grouped deliveries by neighborhood and delivery-window density to reduce route fragmentation and minimize total travel time.

Strategy 02

Heuristics

Applied VRP heuristics and algorithm to generate high-quality routes quickly rather than waiting hours for perfect optimization.

Strategy 03

Market Constraints

Encoded local routing knowledge (e.g., “avoid Midtown Tunnel”) directly into the routing cost matrix.

Impact

COMMERCIAL OUTCOMES

  • trending_up
    Reduced redelivery costs by ~$45K annually.
  • trending_up
    Cut ~$175K/year in avoidable fleet maintenance by eliminating overweight van loads.
  • trending_up
    Saved ~$13K/month by enabling warehouse cross-docking.

OPERATIONAL OUTCOMES

  • check_circle_outline
    +7% delivery success rate increase via improved delivery window accuracy.

What I'd do differently

  • Standardize "Cost per Stop" earlier

    Align on cost-per-stop and market profitability before expanding automation so routing logic reflects the true economics of each delivery.

  • Implement Driver Playbooks

    Systematize "tribal knowledge" into digital cues earlier to reduce dependency on experienced market managers.

Artifacts